Regional wind model part 3 - Generating local wind expectancy statistics from a reference wind rose and a regional CFD model
Summary
This post describes the combination of a statistical model of the wind distribution at a reference site (derived in post 1) with a regional model of terrain effects (post 2 to generate wind expectancy statistics for any site.
Formulation of the model
The wind distribution at location coordinates x,y is given by: where and are the coordinates of the reference site.
This might look complicated but it is only a small jump from the statistical model presented in post 1. Here, for each wind direction the velocity distribution from the reference site is weighted by the occurance of that wind direction and then scaled by - the ratio of velocites of the 2 sites. The wind direction is the second part of the equation - now the distribution of the wind angles for the wind direction bin is adjusted by to give a local correction for the site.
The Python implementation of the model is shown below.
for a,w in enumerate(angwords):
    # get statistical model parameters from dictionary
	dists= windModel[w]
    (c, loc, scale) = dists[0:3]
    occurrence=dists[3]
    # generate windspeeds
    vel=weibull_min.rvs(c, loc, scale, size=int(occurrence*8760))
    # gernate wind directions (random in angle bin)
    theta=angbins[a]+(angbins[a+1]-angbins[a])*np.random.random(size=int(dists[3]*8760))
    # load cfd models
    with open('fv'+w+'.pOBJ', "rb") as f:fv=pickle.load(f,)
    with open('ftheta'+w+'.pOBJ', "rb") as f:ftheta=pickle.load(f,)

    # scale by cfd models
    vel=vel*fv(y,x)/fv(y0,x0)
    dirn=dirn + (ftheta(y,x)-ftheta(y0,x0))
    # angle wrap around correction
    dirn[dirn>360]-=360
    dirn[dirn<angbins[0]]+=360
    data_all=np.vstack((data_all,(np.vstack((dirn,vel)).T)))
Note that this will run much faster with all the CFD model functions loaded in memory. Shown above is a low memory implementation of the code which allows it to run on a small web server.
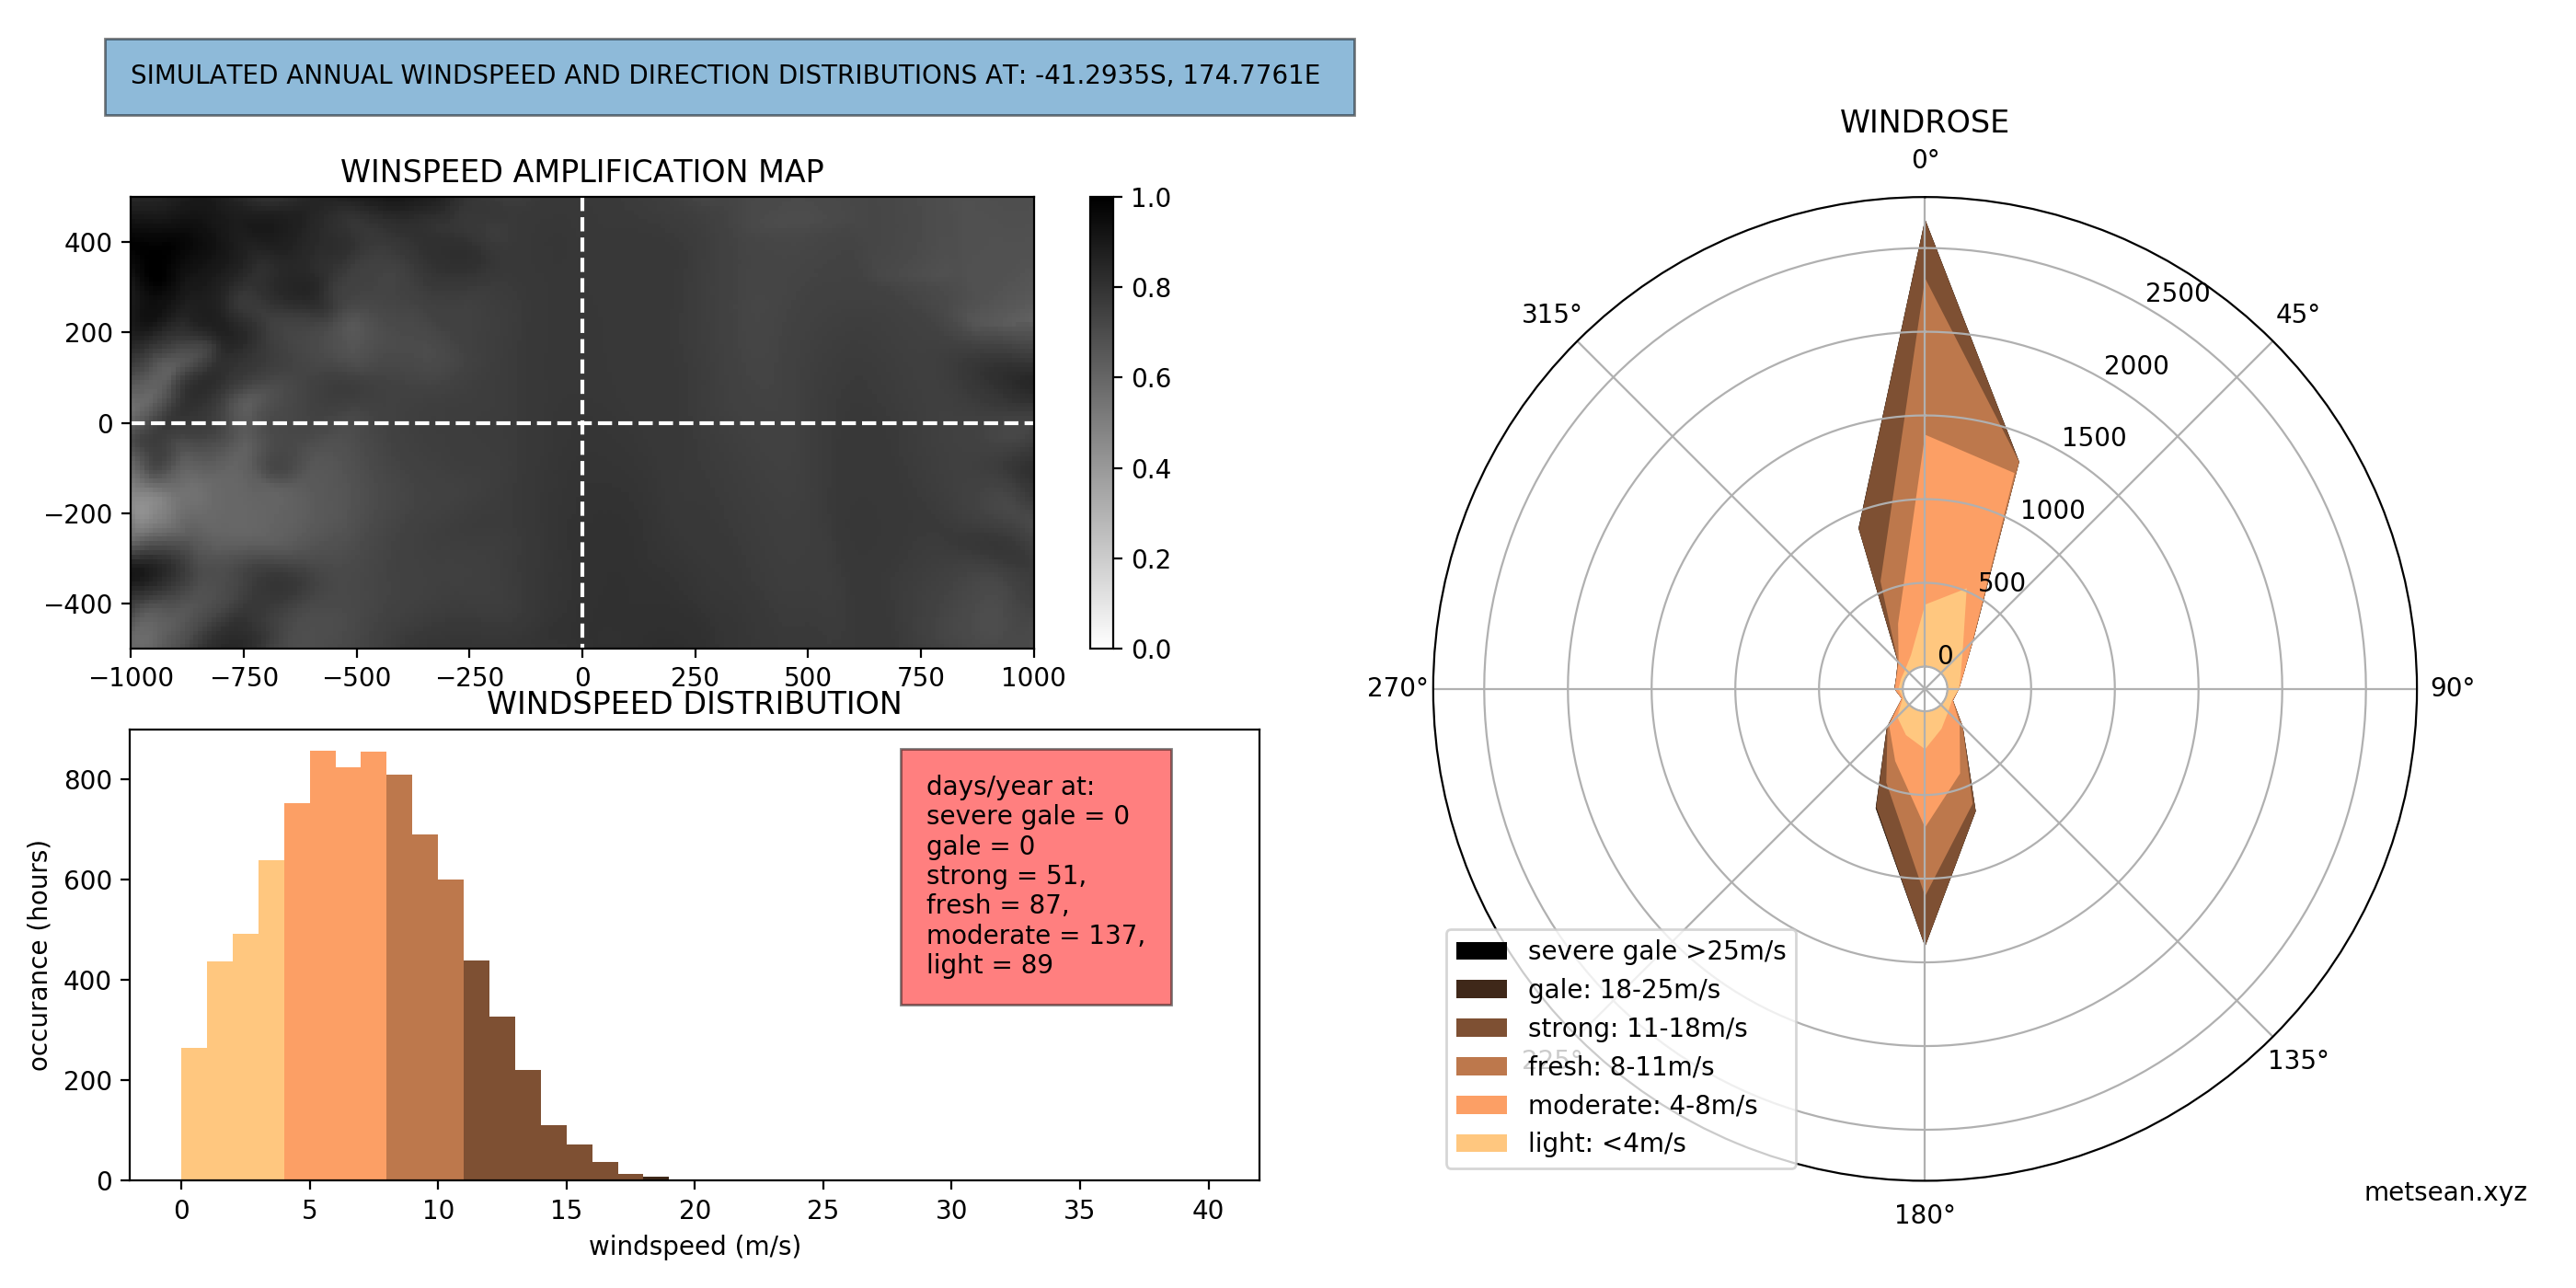
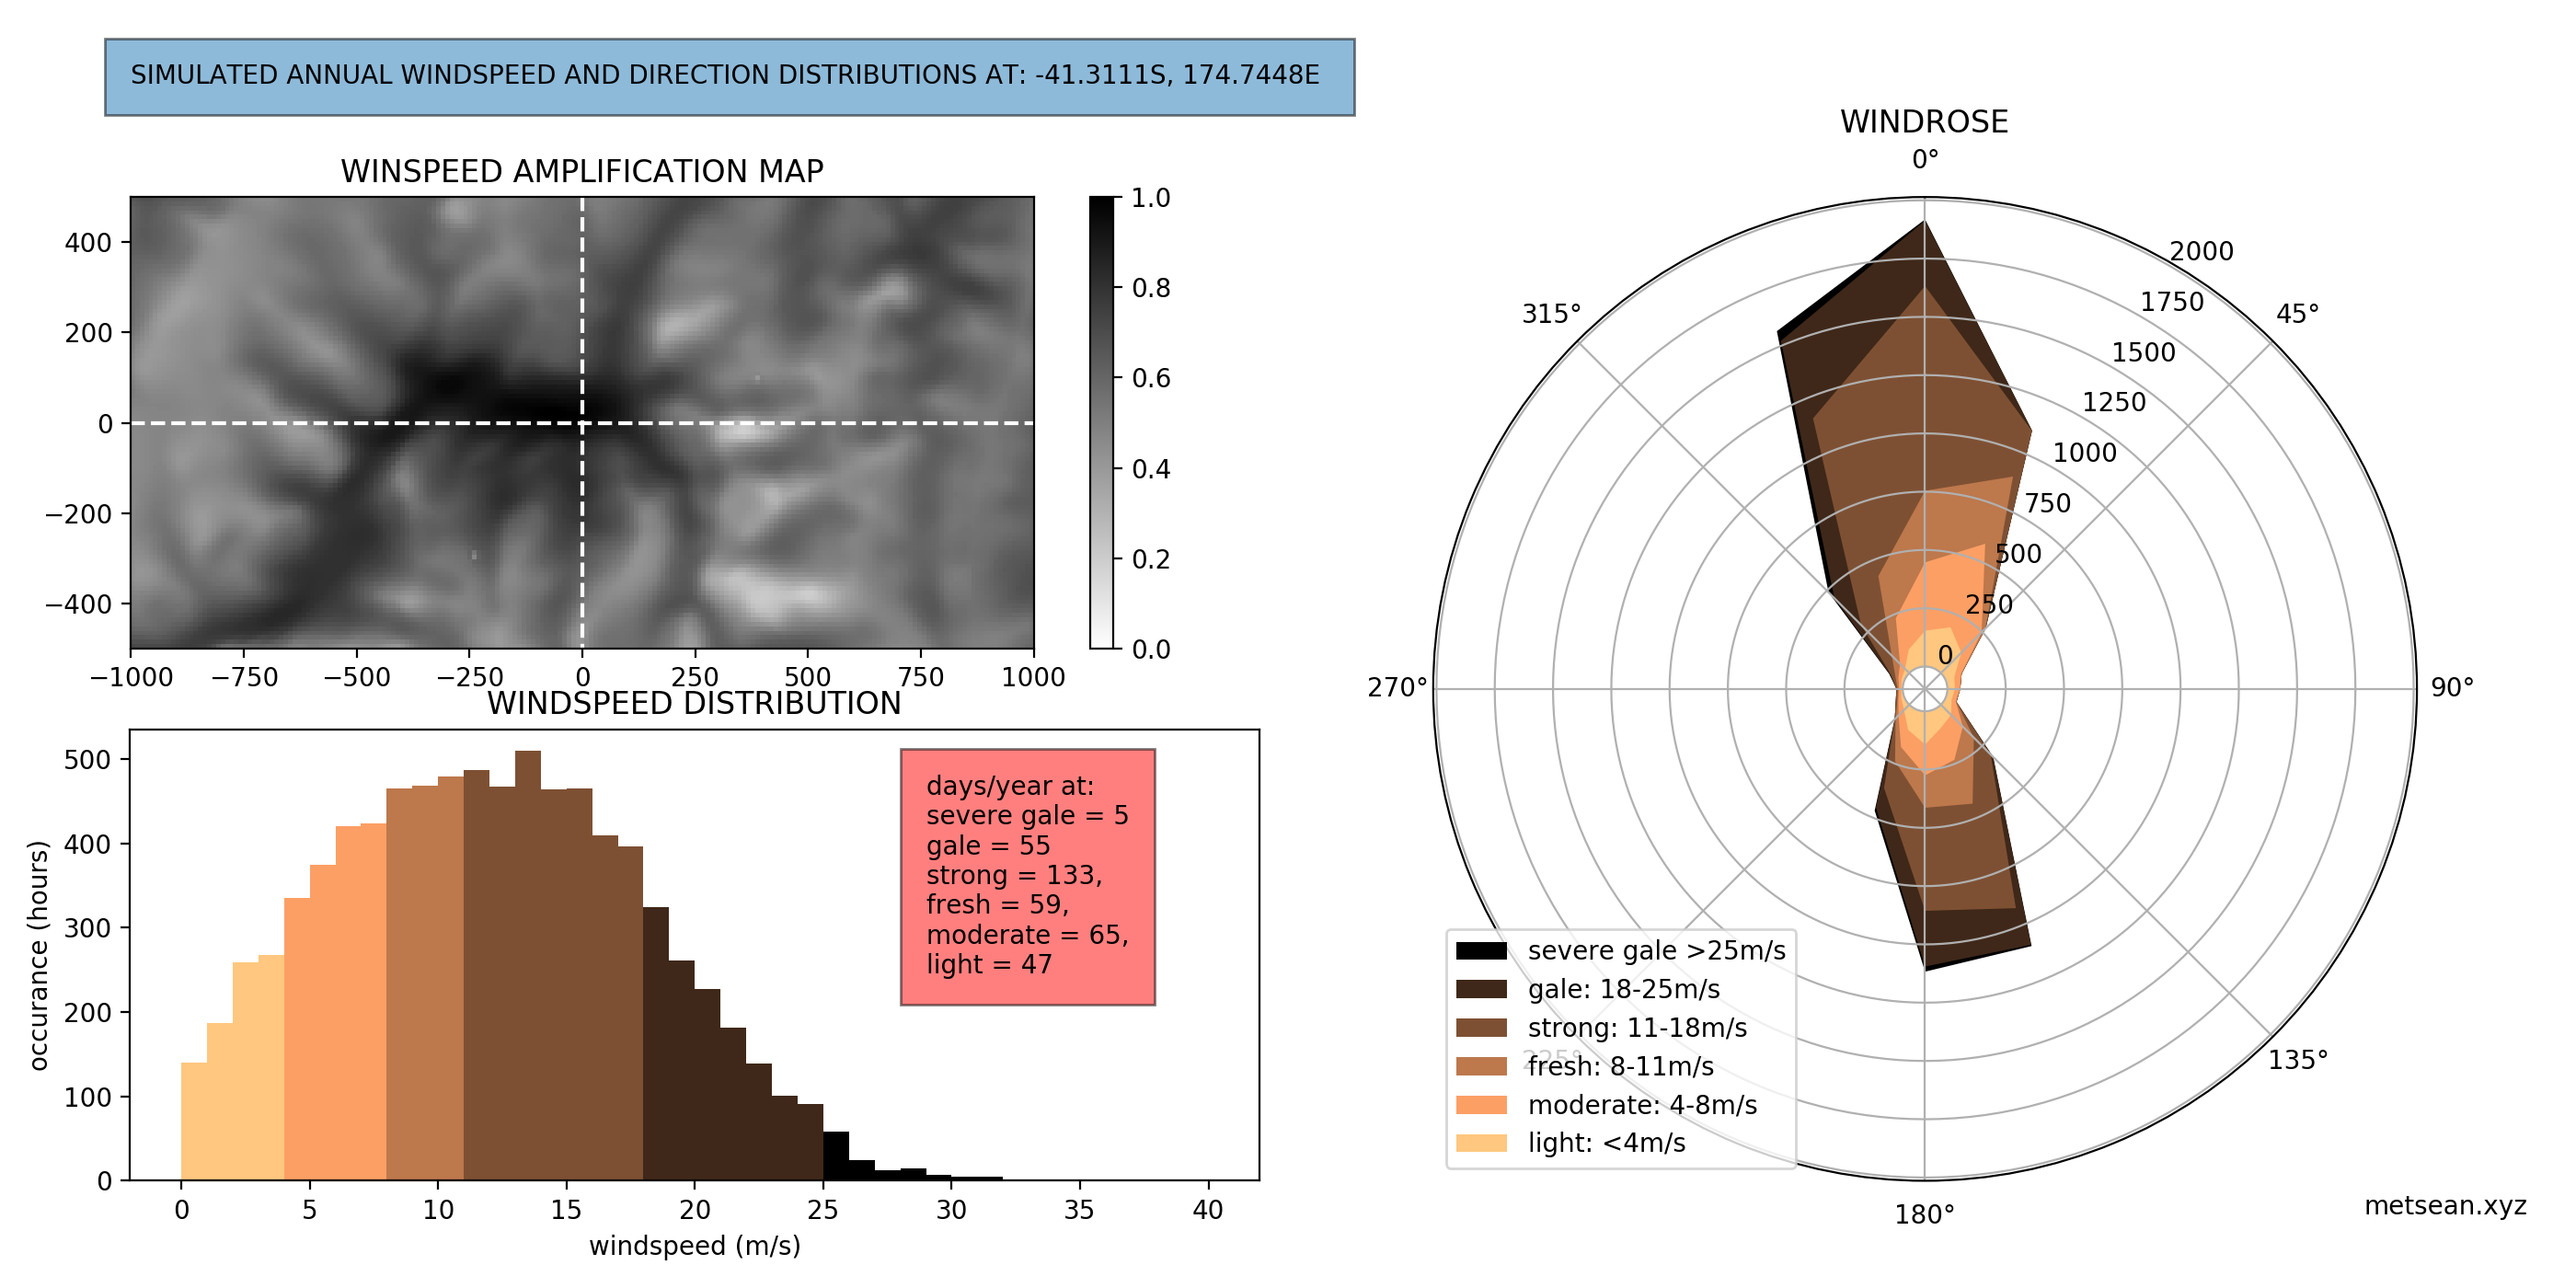
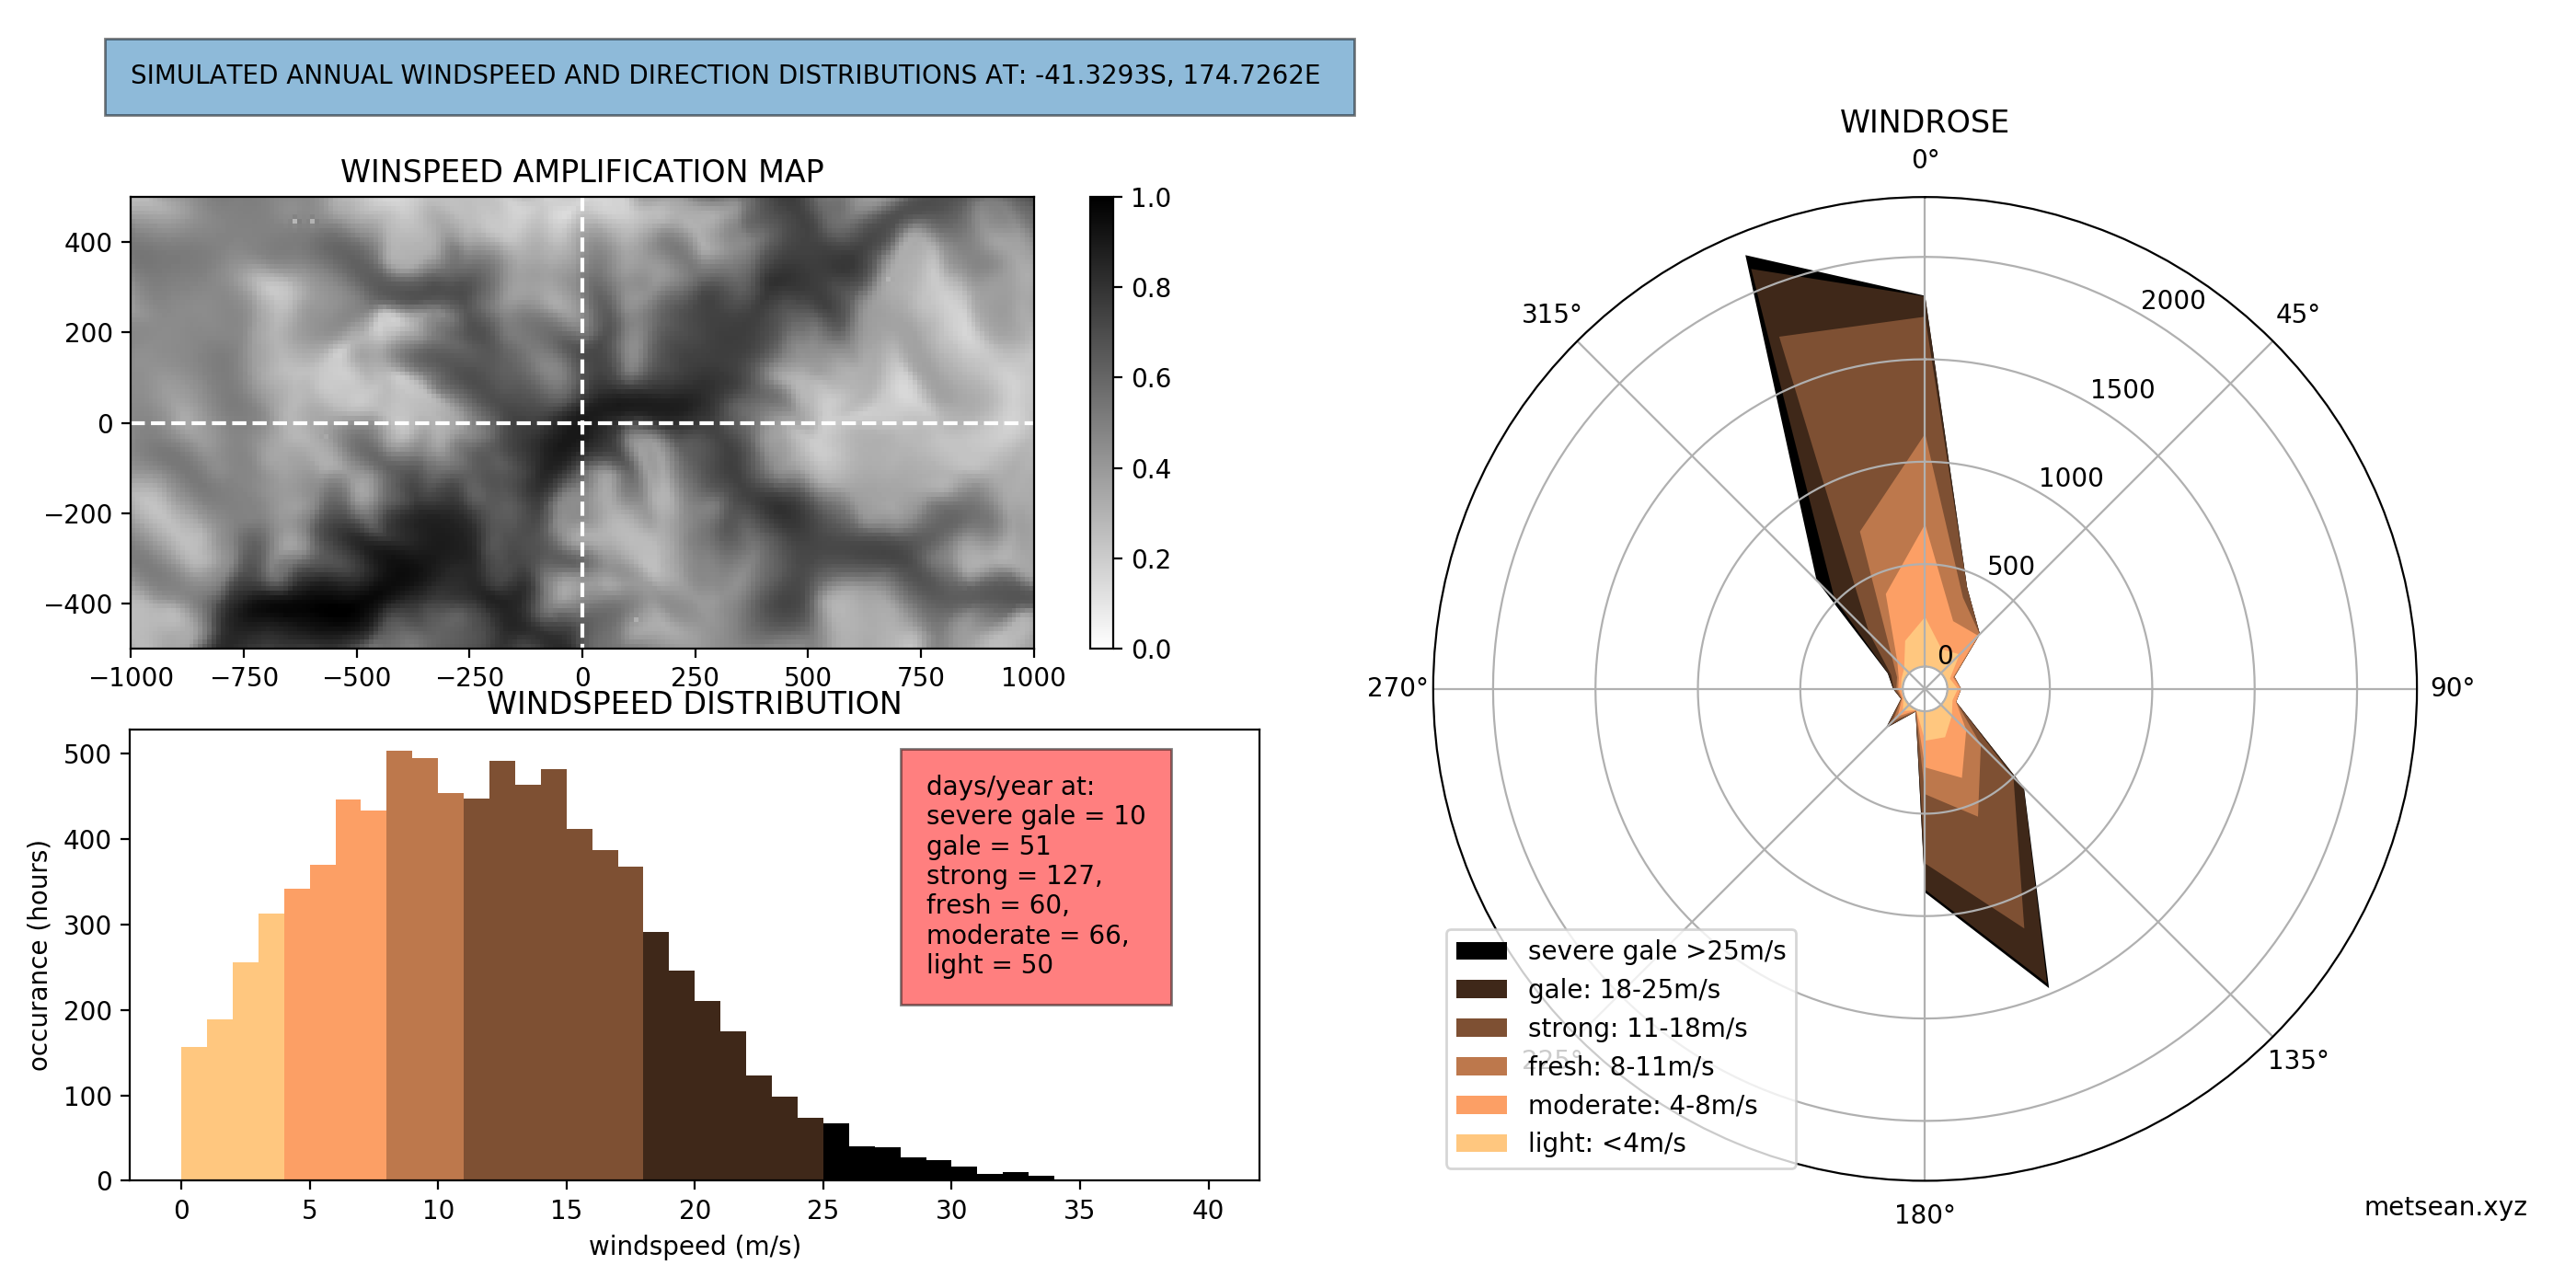
The model output is used to generate a customised report for the particular site which includes a wind rose, a wind speed histogram and an ‘amplification map’ which shows how the site compares to the surrounding terrain in terms of overall windiness. The map is the sum of .
Testing the model
Let’s try out the combined model on some sites around Wellington. Shown below are wind expectancies for a sheltered site in the downtown CBD, and 2 exposed sites on the southern hills of Wellington.
| Site 1 : Wellington CBD |
 |
| Site 2: Brooklyn wind turbine site |
 |
| Site 3: Hawkins hill |
 |
Further work
The accuracy of this model needs to be explored and validated by comparing it’s output to other observational stations. The Kelburn Auotmatic weather station run by the Metservice would be good candidate for this comparison. There will be a long record available for this site, it is located centrally within this model and the terrain is very different to the Wellington Aero site. It is expected that the model becomes less accurate for positions further from the observation station. If this is the case then the model could be improved by having an adaptive reference site which is set to the closest reference site.
It is also expected that the model will become less accurate around the edges of the CFD model. Some work is required to identify the extent of this region and it would be helpful if the model software implementation warned of queries within this region.
The report only displays data of expected hourly averaged wind distributions. This work could be extended by estimating wind gusts. The CFD model includes all the turbulent air properties. Gusts are described by the turbulent kinetic energy and it should be possible to back them out from the model data. This would be very useful as the maximum wind at a site will be as a gust and therefor a key variable describing the environment.
Sharing the model
The model is free to use and publicly accessible here: http://www.metsean.xyz/regModel/-41.2936,174.776050
The API is pretty obvious - edit the url to set the latitude and longitude coordinates to the site of interest. The long term plan is to have a click able map which queries the model and generates the report. I will also look into alternative hosts for the model so that it runs faster. Or make all the code and model data available so it can be run locally.