Monitoring the accuracy of the long range weather forecast
Summary
This project investigated the accuracy of the long range weather forecast. The data, results and analysis are publicly viewable at www.metsean.xyz.
Motivation
This project began in mid 2018 and the main motivation was to explore cloud computing capabilities - which, at the time, were new technologies to me. This work would be an introduction to the Amazon Web Services suite of products.
The question of the weather forecast accuracy is also a fascintating topic - particularly to someone living in Wellington, New Zealand which has a highly varaible climate and is described as offering ‘four seasons in one day’.
The Project Scope
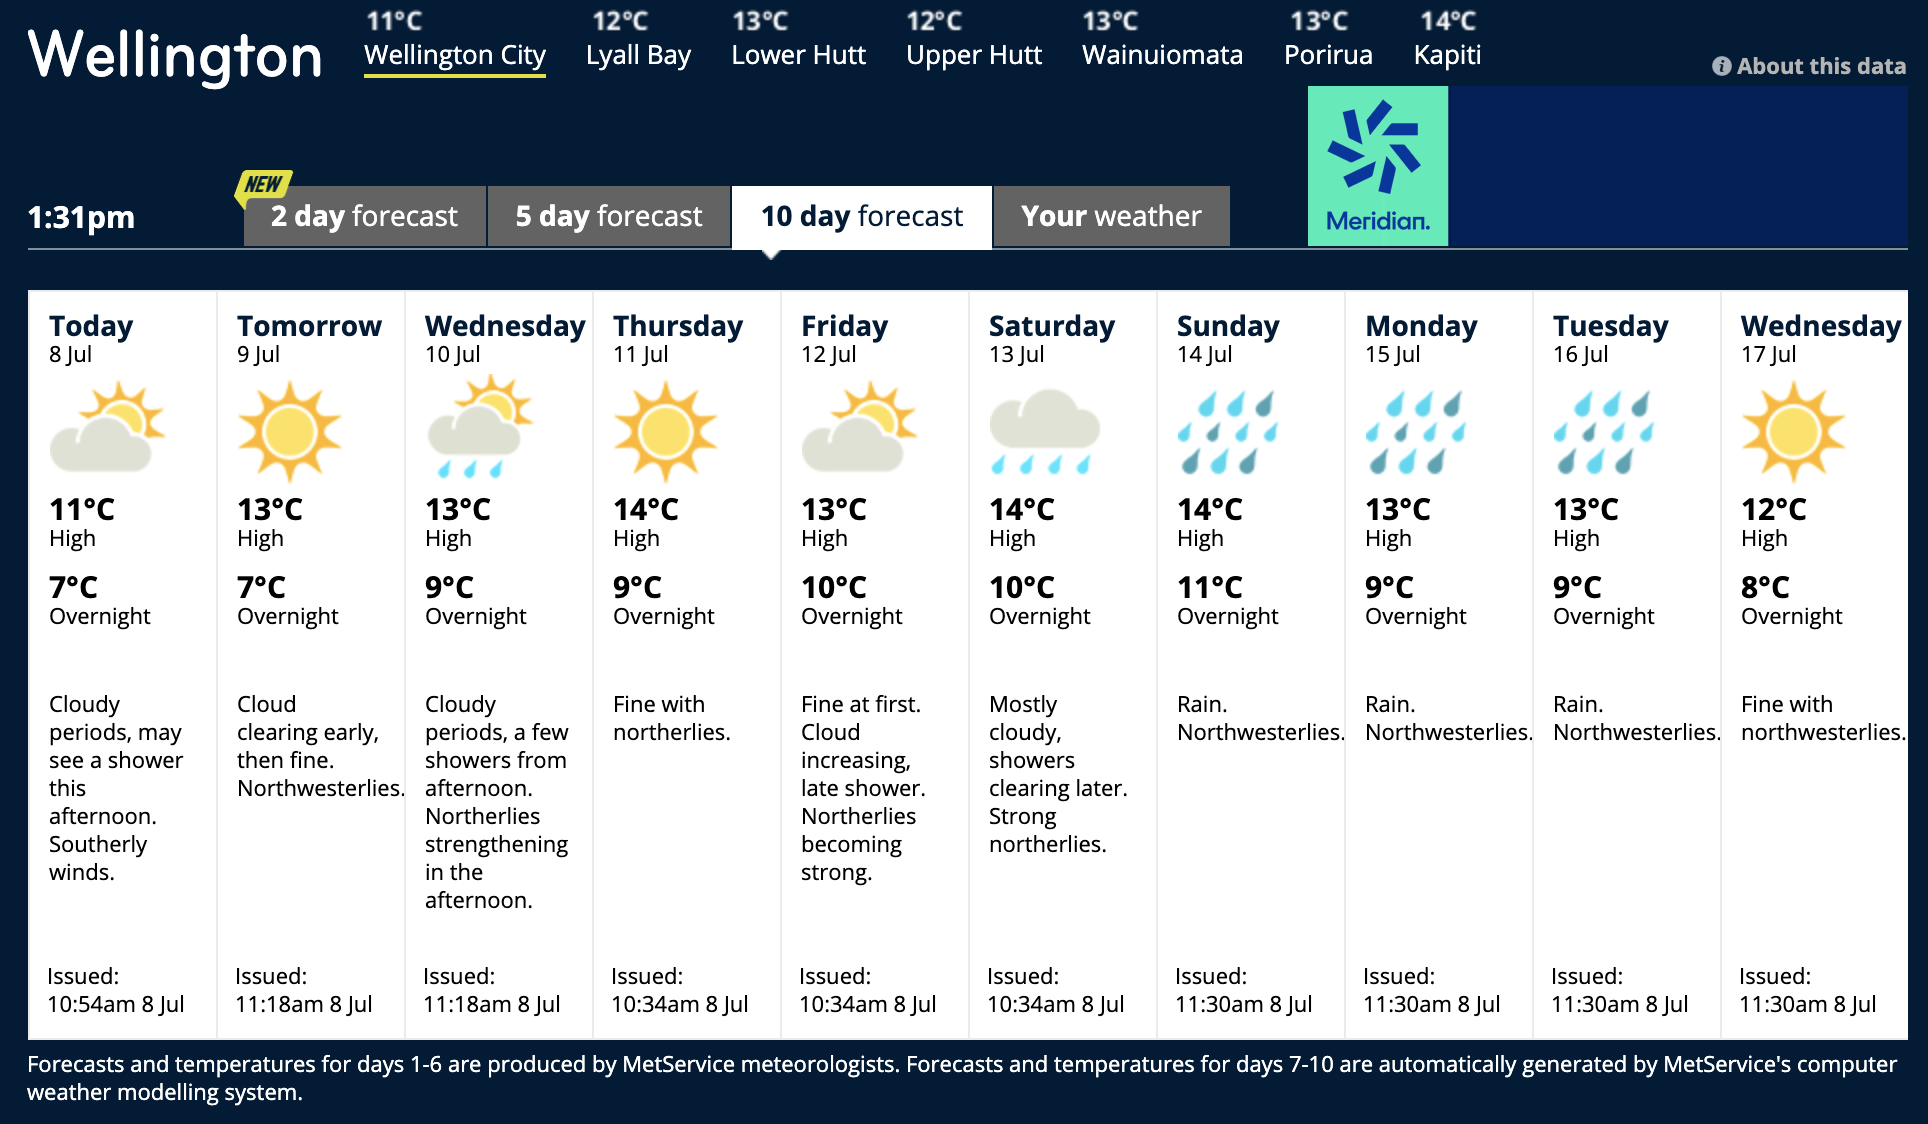
By ‘long term forecast’ I mean rain, wind and temperature predictions projected out to around 10 days from the present. An example for Wellington city provided by the Metservice is shown below.

For days nearer to the present the text forecast is quite specific and includes the variation expected over the course of the day. The text forecast becomes less specific for predictions further into the future. The summary comes with the warning that beyond day 6 the forecasts are the direct model output and there is no moderation by a meteorologist.
My intuition tells me that the forecasts are initially quite accurate but become less so as they project further into the future. By days 8-9 I would doubt the accuracy of the forecast and not have the confidence to make any decisions based on the predictions.
The goal of this project is to quantify the statistical accuracy of these forecast predictions against time and to determine at what point they become not useful (if indeed they do). The forecasts provided by the Metservice, Niwa, yr.no and the Weather Channel will be compared in this analysis. The investigation will be for just the main cities of New Zealand; Auckland, Wellington and Christchurch.
Obtaining Data
The project runs on an AWS-ec2 t2.micro Ubuntu virtual machine. A number of Python scripts run automatically as chron jobs every day and scrape the forecast data for all available days from the different forecasters websites. For some of the providers there is a public API that makes the forecast data easily obtainable. The Metservice data was the hardest to extract and required direct parsing of the html.
The forecasts need to be judged against what the weather actually was. To allow for this comparison the observed weather at a number of different meteorological stations in each region was also recorded. This was scraped from the the Metservice forecast pages.
All of the forecast and observation data was logged into an AWS RDS database. This data collection phase has been running since mid 2018 and there is a nice size data set ready for some analysis.
Data Analysis
A goal for this project was to build a public front end so that interested people could look back on the forecast history and to see how my scoring was done. A web application was built using the Python Flask framework. This is publicly viewable at www.metsean.xyz.
This metsean application interacts with the RDS databases allowing the user to query the forecast and observation history. The text forecasts are presented in a tabular form.
At this stage only scoring of the rain forecast has been implemented. The rain forecast data, which is conveyed in slightly different ways for each forecaster, is first converted to a binary rain/no rain prediction. For the Metservice the prediction comes from the forecast text - if showers, rain, drizzle, sleet, or snow are mentioned then the forecast is considered to predict rain. For Niwa and yr.no the forecasted precipitation is given in mm - forcasts predicting totals > 0mm are considered predictions of rain. The weather.com forecasts give a probability of precipitation and values > 10 are considered predictions of rain. Rain is considered to have occurred if any of the observation stations recorded a total > 0mm.
The forecast is scored by judging the binary rain prediction against the binary rain observation. The forecast scores as correct if rain is predicted and rain is observed or rain is not predicted and rain is observed. Other cases count as an incorrect forecast.
For days prior to the present day the observations can be viewed on the region pages. Correct rain forecasts are indicated by a green cell shading in the forecast table.
The overall accuracy of the rain forecasts can be calculated by summing the number of correct forecasts and diving by the total number of forecasts. These plots update daily and can be viewed here.